In probability theory and statistics, a copula is a multivariate cumulative distribution function for which the marginal probability distribution of each variable is uniform on the interval [0, 1]. Copulas are used to describe the dependence between random variables. Their name comes from the Latin for "link" or "tie", similar but unrelated to grammatical copulas in linguistics[citation needed]. Copulas have been used widely in quantitative finance to model and minimize tail risk[1] and portfolio-optimization applications.[2]
Sklar's theorem states that any multivariate joint distribution can be written in terms of univariate marginal distribution functions and a copula which describes the dependence structure between the variables.
Copulas are popular in high-dimensional statistical applications as they allow one to easily model and estimate the distribution of random vectors by estimating marginals and copulae separately. There are many parametric copula families available, which usually have parameters that control the strength of dependence. Some popular parametric copula models are outlined below.
Two-dimensional copulas are known in some other areas of mathematics under the name permutons and doubly-stochastic measures.
Mathematical definitionEditConsider a random vector  . Suppose its marginals are continuous, i.e. the marginal CDFs
 ![{\displaystyle F_{i}(x)=\Pr[X_{i}\leq x]}](https://wikimedia.org/api/rest_v1/media/math/render/svg/2980e5dcb25467ed9d2238ba1990c9aff7ca8b5c) are continuous functions. By applying the probability integral transform to each component, the random vector
are continuous functions. By applying the probability integral transform to each component, the random vector

has marginals that are uniformly distributed on the interval [0, 1].
The copula of is defined as the joint cumulative distribution function of  :
:
![{\displaystyle C(u_{1},u_{2},\dots ,u_{d})=\Pr[U_{1}\leq u_{1},U_{2}\leq u_{2},\dots ,U_{d}\leq u_{d}].}](https://wikimedia.org/api/rest_v1/media/math/render/svg/9a94a2eeb84fc83baad8a1e819ff4f8b46b9fd07)
The copula C contains all information on the dependence structure between the components of whereas the marginal cumulative distribution functions  contain all information on the marginal distributions of
  .
.
The reverse of these steps can be used to generate pseudo-random samples from general classes of multivariate probability distributions. That is, given a procedure to generate a sample from the copula function, the required sample can be constructed as

The inverses  are unproblematic as the were assumed to be continuous. Furthermore, the above formula for the copula function can be rewritten as:
![{\displaystyle C(u_{1},u_{2},\dots ,u_{d})=\Pr[X_{1}\leq F_{1}^{-1}(u_{1}),X_{2}\leq F_{2}^{-1}(u_{2}),\dots ,X_{d}\leq F_{d}^{-1}(u_{d})].}](https://wikimedia.org/api/rest_v1/media/math/render/svg/01a3e0330faabf83d10247540cabac352edd1f5a)
DefinitionEditIn probabilistic terms, ![C:[0,1]^{d}\rightarrow [0,1]](https://wikimedia.org/api/rest_v1/media/math/render/svg/40af55f356a2e5d65a93019852c1c5e0cbf07625) is a d-dimensional copula if C is a joint cumulative distribution function of a d-dimensional random vector on the unit cube
is a d-dimensional copula if C is a joint cumulative distribution function of a d-dimensional random vector on the unit cube ![[0,1]^{d}](https://wikimedia.org/api/rest_v1/media/math/render/svg/e13ae4917276744b214714a20b3cb8ee305e309d) with uniform marginals.[3]
with uniform marginals.[3]
In analytic terms, is a d-dimensional copula if
 , the copula is zero if any one of the arguments is zero,
 , the copula is equal to u if one argument is u and all others 1,
- C is d-non-decreasing, i.e., for each hyperrectangle
![B=\prod _{i=1}^{d}[x_{i},y_{i}]\subseteq [0,1]^{d}](https://wikimedia.org/api/rest_v1/media/math/render/svg/351f96aa29a3d1851e3bbc80c6348449ffe0746c) the C-volume of B is non-negative:
the C-volume of B is non-negative:
- where the
 .
.
For instance, in the bivariate case, ![{\displaystyle C:[0,1]\times [0,1]\rightarrow [0,1]}](https://wikimedia.org/api/rest_v1/media/math/render/svg/f271c6025d698ce8ebf1078044d193b1a5587a94) is a bivariate copula if
is a bivariate copula if  ,
,  and
and  for all
  and
and  .
.
Sklar's theoremEdit
Density and contour plot of a Bivariate Gaussian Distribution

Density and contour plot of two Normal marginals joint with a Gumbel copula
Sklar's theorem, named after Abe Sklar, provides the theoretical foundation for the application of copulas.[4][5] Sklar's theorem states that every multivariate cumulative distribution function
![{\displaystyle H(x_{1},\dots ,x_{d})=\Pr[X_{1}\leq x_{1},\dots ,X_{d}\leq x_{d}]}](https://wikimedia.org/api/rest_v1/media/math/render/svg/2b6e179e9bd5d86f303c58ae8fef0e67155ddbce)
of a random vector can be expressed in terms of its marginals ![{\displaystyle F_{i}(x_{i})=\Pr[X_{i}\leq x_{i}]}](https://wikimedia.org/api/rest_v1/media/math/render/svg/787d08554a01e4fc5b4100e85eb73e3137cf5cf1) and a copula
and a copula  . Indeed:

In case that the multivariate distribution has a density  , and if this is available, it holds further that

where  is the density of the copula.
The theorem also states that, given  , the copula is unique on
  , which is the cartesian product of the ranges of the marginal cdf's. This implies that the copula is unique if the marginals are continuous.
The converse is also true: given a copula and marginals  then
then  defines a d-dimensional cumulative distribution function with marginal distributions .
Stationarity conditionEditCopulas mainly work when time series are stationary[6] and continuous.[7] Thus, a very important pre-processing step is to check for the auto-correlation, trend and seasonality within time series.
When time series are auto-correlated, they may generate a non existence dependence between sets of variables and result in incorrect Copula dependence structure.[8]
Fréchet–Hoeffding copula boundsEdit
Graphs of the bivariate Fréchet–Hoeffding copula limits and of the independence copula (in the middle).
The Fréchet–Hoeffding Theorem (after Maurice René Fréchet and Wassily Hoeffding[9]) states that for any Copula and any ![(u_{1},\dots ,u_{d})\in [0,1]^{d}](https://wikimedia.org/api/rest_v1/media/math/render/svg/f357cb50ea6b8e6f47f4f470b5436fa090f658c6) the following bounds hold:
the following bounds hold:

The function W is called lower Fréchet–Hoeffding bound and is defined as

The function M is called upper Fréchet–Hoeffding bound and is defined as

The upper bound is sharp: M is always a copula, it corresponds to comonotone random variables.
The lower bound is point-wise sharp, in the sense that for fixed u, there is a copula  such that
  . However, W is a copula only in two dimensions, in which case it corresponds to countermonotonic random variables.
In two dimensions, i.e. the bivariate case, the Fréchet–Hoeffding Theorem states
 .
.
Families of copulasEditSeveral families of copulas have been described.
Gaussian copulaEdit
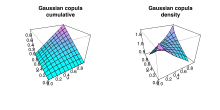
Cumulative and density distribution of Gaussian copula with ρ = 0.4
The Gaussian copula is a distribution over the unit cube . It is constructed from a multivariate normal distribution over  by using the probability integral transform.
For a given correlation matrix ![{\displaystyle R\in [-1,1]^{d\times d}}](https://wikimedia.org/api/rest_v1/media/math/render/svg/1a071e34a31e85adcd94121469d8f270035b2eaf) , the Gaussian copula with parameter matrix
, the Gaussian copula with parameter matrix  can be written as

where  is the inverse cumulative distribution function of a standard normal and
  is the joint cumulative distribution function of a multivariate normal distribution with mean vector zero and covariance matrix equal to the correlation matrix . While there is no simple analytical formula for the copula function,
  , it can be upper or lower bounded, and approximated using numerical integration.[10][11] The density can be written as[12]

where  is the identity matrix.
Archimedean copulasEdit
Archimedean copulas are an associative class of copulas. Most common Archimedean copulas admit an explicit formula, something not possible for instance for the Gaussian copula. In practice, Archimedean copulas are popular because they allow modeling dependence in arbitrarily high dimensions with only one parameter, governing the strength of dependence.
A copula C is called Archimedean if it admits the representation[13]
![{\displaystyle C(u_{1},\dots ,u_{d};\theta )=\psi ^{[-1]}\left(\psi (u_{1};\theta )+\cdots +\psi (u_{d};\theta );\theta \right)}](https://wikimedia.org/api/rest_v1/media/math/render/svg/e14136d227b55fcd8527f288eeb736d0279e2d85)
where ![\psi \!:[0,1]\times \Theta \rightarrow [0,\infty )](https://wikimedia.org/api/rest_v1/media/math/render/svg/72604f5871b27926c148bace5587ddf8d8c16946) is a continuous, strictly decreasing and convex function such that
is a continuous, strictly decreasing and convex function such that  ,
,  is a parameter within some parameter space
  , and
, and  is the so-called generator function and
 ![\psi ^{[-1]}](https://wikimedia.org/api/rest_v1/media/math/render/svg/6f5a9a83275e37dfa551138b6420eadcb18e7917) is its pseudo-inverse defined by
is its pseudo-inverse defined by
![{\displaystyle \psi ^{[-1]}(t;\theta )=\left\{{\begin{array}{ll}\psi ^{-1}(t;\theta )&{\mbox{if }}0\leq t\leq \psi (0;\theta )\\0&{\mbox{if }}\psi (0;\theta )\leq t\leq \infty .\end{array}}\right.}](https://wikimedia.org/api/rest_v1/media/math/render/svg/a1f44a5e0acb87f721756ccfa4172e461dc039a9)
Moreover, the above formula for C yields a copula for  if and only if is d-monotone on
  .[14] That is, if it is
  times differentiable and the derivatives satisfy

for all  and
and  and
and  is nonincreasing and convex.
Most important Archimedean copulasEdit
The following tables highlight the most prominent bivariate Archimedean copulas, with their corresponding generator. Not all of them are completely monotone, i.e. d-monotone for all  or d-monotone for certain
  only.
only.
Table with the most important Archimedean copulas[13]| Name of copula | Bivariate copula  | parameter |
|---|
| Ali–Mikhail–Haq[15] |  | |
| Clayton[16] | ![\left[\max \left\{u^{-\theta }+v^{-\theta }-1;0\right\}\right]^{-1/\theta }](https://wikimedia.org/api/rest_v1/media/math/render/svg/7266b1df307368fd625b261caee57a2136bcd521) | |
| Frank | ![-{\frac {1}{\theta }}\log \!\left[1+{\frac {(\exp(-\theta u)-1)(\exp(-\theta v)-1)}{\exp(-\theta )-1}}\right]](https://wikimedia.org/api/rest_v1/media/math/render/svg/594e71d78f84f97fa19a76d57940d15fe68f998e) | |
| Gumbel | ![{\textstyle \exp \!\left[-\left((-\log(u))^{\theta }+(-\log(v))^{\theta }\right)^{1/\theta }\right]}](https://wikimedia.org/api/rest_v1/media/math/render/svg/739c3170ca7ea51fe7489b2e6248e8fe26768720) | |
| Independence |  | |
| Joe | ![{\textstyle {1-\left[(1-u)^{\theta }+(1-v)^{\theta }-(1-u)^{\theta }(1-v)^{\theta }\right]^{1/\theta }}}](https://wikimedia.org/api/rest_v1/media/math/render/svg/c30e67e928a1c0940b7b030587d29affda291fc4) | |
Table of correspondingly most important generators[13]| name | generator  | generator inverse |
|---|
| Ali–Mikhail–Haq[15] | ![\log \!\left[{\frac {1-\theta (1-t)}{t}}\right]](https://wikimedia.org/api/rest_v1/media/math/render/svg/4cd29ebc997de95a338f66163136f5513152e4e3) |  |
| Clayton[16] |  |  |
| Frank |  |  |
| Gumbel |  |  |
| Independence |  |  |
| Joe |  |  |
Expectation for copula models and Monte Carlo integrationEditIn statistical applications, many problems can be formulated in the following way. One is interested in the expectation of a response function  applied to some random vector
  .[17] If we denote the cdf of this random vector with , the quantity of interest can thus be written as
![{\displaystyle \operatorname {E} \left[g(X_{1},\dots ,X_{d})\right]=\int _{\mathbb {R} ^{d}}g(x_{1},\dots ,x_{d})\,\mathrm {d} H(x_{1},\dots ,x_{d}).}](https://wikimedia.org/api/rest_v1/media/math/render/svg/d3b79232a4f8caba8f38d321679233824256d4d3)
If is given by a copula model, i.e.,

this expectation can be rewritten as
![{\displaystyle \operatorname {E} \left[g(X_{1},\dots ,X_{d})\right]=\int _{[0,1]^{d}}g(F_{1}^{-1}(u_{1}),\dots ,F_{d}^{-1}(u_{d}))\,\mathrm {d} C(u_{1},\dots ,u_{d}).}](https://wikimedia.org/api/rest_v1/media/math/render/svg/926f937f6b5cdce4c11e058b18cf41ac585a0324)
In case the copula C is absolutely continuous, i.e. C has a density c, this equation can be written as
![{\displaystyle \operatorname {E} \left[g(X_{1},\dots ,X_{d})\right]=\int _{[0,1]^{d}}g(F_{1}^{-1}(u_{1}),\dots ,F_{d}^{-1}(u_{d}))\cdot c(u_{1},\dots ,u_{d})\,du_{1}\cdots \mathrm {d} u_{d},}](https://wikimedia.org/api/rest_v1/media/math/render/svg/7e63d57530cb81f73691e124bbe7ef057a65b29e)
and if each marginal distribution has the density  it holds further that
![{\displaystyle \operatorname {E} \left[g(X_{1},\dots ,X_{d})\right]=\int _{\mathbb {R} ^{d}}g(x_{1},\dots x_{d})\cdot c(F_{1}(x_{1}),\dots ,F_{d}(x_{d}))\cdot f_{1}(x_{1})\cdots f_{d}(x_{d})\,\mathrm {d} x_{1}\cdots \mathrm {d} x_{d}.}](https://wikimedia.org/api/rest_v1/media/math/render/svg/cea4d38bc3f0acf3b8a35a0db2922da06bd02fa9)
If copula and margins are known (or if they have been estimated), this expectation can be approximated through the following Monte Carlo algorithm:
- Draw a sample
 of size n from the copula C
 - By applying the inverse marginal cdf's, produce a sample of by setting

- Approximate
![{\displaystyle \operatorname {E} \left[g(X_{1},\dots ,X_{d})\right]}](https://wikimedia.org/api/rest_v1/media/math/render/svg/ba4b7e451d1c2f65485ec3b5f1469324bafacb52) by its empirical value:
by its empirical value:
![{\displaystyle \operatorname {E} \left[g(X_{1},\dots ,X_{d})\right]\approx {\frac {1}{n}}\sum _{k=1}^{n}g(X_{1}^{k},\dots ,X_{d}^{k})}](https://wikimedia.org/api/rest_v1/media/math/render/svg/6f1c7564cfbe956cd4fe9d987b4a185270bb4914)
Empirical copulasEditWhen studying multivariate data, one might want to investigate the underlying copula. Suppose we have observations

from a random vector with continuous margins. The corresponding "true" copula observations would be

However, the marginal distribution functions are usually not known. Therefore, one can construct pseudo copula observations by using the empirical distribution functions

instead. Then, the pseudo copula observations are defined as

The corresponding empirical copula is then defined as

The components of the pseudo copula samples can also be written as  , where
  is the rank of the observation
  :
:

Therefore, the empirical copula can be seen as the empirical distribution of the rank transformed data.
ApplicationsEditQuantitative financeEdit

Examples of bivariate copulæ used in finance.
Typical finance applications:- Analyzing systemic risk in financial markets[18]
- Analyzing and pricing spread options, in particular in fixed income constant maturity swap spread options
- Analyzing and pricing volatility smile/skew of exotic baskets, e.g. best/worst of
- Analyzing and pricing volatility smile/skew of less liquid FX[clarification needed] cross, which is effectively a basket: C = S1/S2 or C = S1·S2
- Value-at-Risk forecasting and portfolio optimization to minimize tail risk for US and international equities[1]
- Forecasting equities returns for higher-moment portfolio optimization/full-scale optimization[18]
- Improving the estimates of a portfolio's expected return and variance-covariance matrix for input into sophisticated mean-variance optimization strategies[2]
- Statistical arbitrage strategies including pairs trading[19]
|
In quantitative finance copulas are applied to risk management, to portfolio management and optimization, and to derivatives pricing.
For the former, copulas are used to perform stress-tests and robustness checks that are especially important during "downside/crisis/panic regimes" where extreme downside events may occur (e.g., the global financial crisis of 2007–2008). The formula was also adapted for financial markets and was used to estimate the probability distribution of losses on pools of loans or bonds.
During a downside regime, a large number of investors who have held positions in riskier assets such as equities or real estate may seek refuge in 'safer' investments such as cash or bonds. This is also known as a flight-to-quality effect and investors tend to exit their positions in riskier assets in large numbers in a short period of time. As a result, during downside regimes, correlations across equities are greater on the downside as opposed to the upside and this may have disastrous effects on the economy.[20][21] For example, anecdotally, we often read financial news headlines reporting the loss of hundreds of millions of dollars on the stock exchange in a single day; however, we rarely read reports of positive stock market gains of the same magnitude and in the same short time frame.
Copulas aid in analyzing the effects of downside regimes by allowing the modelling of the marginals and dependence structure of a multivariate probability model separately. For example, consider the stock exchange as a market consisting of a large number of traders each operating with his/her own strategies to maximize profits. The individualistic behaviour of each trader can be described by modelling the marginals. However, as all traders operate on the same exchange, each trader's actions have an interaction effect with other traders'. This interaction effect can be described by modelling the dependence structure. Therefore, copulas allow us to analyse the interaction effects which are of particular interest during downside regimes as investors tend to herd their trading behaviour and decisions. (See also agent-based computational economics, where price is treated as an emergent phenomenon, resulting from the interaction of the various market participants, or agents.)
The users of the formula have been criticized for creating "evaluation cultures" that continued to use simple copulæ despite the simple versions being acknowledged as inadequate for that purpose.[22] Thus, previously, scalable copula models for large dimensions only allowed the modelling of elliptical dependence structures (i.e., Gaussian and Student-t copulas) that do not allow for correlation asymmetries where correlations differ on the upside or downside regimes. However, the recent development of vine copulas[23] (also known as pair copulas) enables the flexible modelling of the dependence structure for portfolios of large dimensions.[24] The Clayton canonical vine copula allows for the occurrence of extreme downside events and has been successfully applied in portfolio optimization and risk management applications. The model is able to reduce the effects of extreme downside correlations and produces improved statistical and economic performance compared to scalable elliptical dependence copulas such as the Gaussian and Student-t copula.[25]
Other models developed for risk management applications are panic copulas that are glued with market estimates of the marginal distributions to analyze the effects of panic regimes on the portfolio profit and loss distribution. Panic copulas are created by Monte Carlo simulation, mixed with a re-weighting of the probability of each scenario.[26]
As regards derivatives pricing, dependence modelling with copula functions is widely used in applications of financial risk assessment and actuarial analysis – for example in the pricing of collateralized debt obligations (CDOs).[27] Some believe the methodology of applying the Gaussian copula to credit derivatives to be one of the reasons behind the global financial crisis of 2008–2009;[28][29][30] see David X. Li § CDOs and Gaussian copula.
Despite this perception, there are documented attempts within the financial industry, occurring before the crisis, to address the limitations of the Gaussian copula and of copula functions more generally, specifically the lack of dependence dynamics. The Gaussian copula is lacking as it only allows for an elliptical dependence structure, as dependence is only modeled using the variance-covariance matrix.[25] This methodology is limited such that it does not allow for dependence to evolve as the financial markets exhibit asymmetric dependence, whereby correlations across assets significantly increase during downturns compared to upturns. Therefore, modeling approaches using the Gaussian copula exhibit a poor representation of extreme events.[25][31] There have been attempts to propose models rectifying some of the copula limitations.[31][32][33]
Additional to CDOs, Copulas have been applied to other asset classes as a flexible tool in analyzing multi-asset derivative products. The first such application outside credit was to use a copula to construct a basket implied volatility surface,[34] taking into account the volatility smile of basket components. Copulas have since gained popularity in pricing and risk management[35] of options on multi-assets in the presence of a volatility smile, in equity-, foreign exchange- and fixed income derivatives.
Civil engineeringEdit
Recently, copula functions have been successfully applied to the database formulation for the reliability analysis of highway bridges, and to various multivariate simulation studies in civil engineering,[36] reliability of wind and earthquake engineering,[37] and mechanical & offshore engineering.[38] Researchers are also trying these functions in the field of transportation to understand the interaction between behaviors of individual drivers which, in totality, shapes traffic flow.
Reliability engineeringEdit
Copulas are being used for reliability analysis of complex systems of machine components with competing failure modes. [39]
Warranty data analysisEdit
Copulas are being used for warranty data analysis in which the tail dependence is analysed [40]
Turbulent combustionEdit
Copulas are used in modelling turbulent partially premixed combustion, which is common in practical combustors. [41][42]
MedicineEdit
Copula has many applications in the area of medicine, for example,
- Copula has been used in the field of magnetic resonance imaging (MRI), for example, to segment images,[43] to fill a vacancy of graphical models in imaging genetics in a study on schizophrenia,[44] and to distinguish between normal and Alzheimer patients.[45]
- Copula has been in the area of brain research based on EEG signals, for example, to detect drowsiness during daytime nap,[46] to track changes in instantaneous equivalent bandwidths (IEBWs),[47] to derive synchrony for early diagnosis of Alzheimer's disease,[48] to characterize dependence in oscillatory activity between EEG channels,[49] and to assess the reliability of using methods to capture dependence between pairs of EEG channels using their time-varying envelopes.[50] Copula functions have been successfully applied to the analysis of neuronal dependencies[51] and spike counts in neuroscience .[52]
- A copula model has been developed in the field of oncology, for example, to jointly model genotypes, phenotypes, and pathways to reconstruct a cellular network to identify interactions between specific phenotype and multiple molecular features (e.g. mutations and gene expression change). Bao et al.[53] used NCI60 cancer cell line data to identify several subsets of molecular features that jointly perform as the predictors of clinical phenotypes. The proposed copula may have an impact on biomedical research, ranging from cancer treatment to disease prevention. Copula has also been used to predict the histological diagnosis of colorectal lesions from colonoscopy images,[54] and to classify cancer subtypes.[55]
GeodesyEdit
The combination of SSA and Copula-based methods have been applied for the first time as a novel stochastic tool for EOP prediction.[56][57]
Hydrology researchEdit
Copulas have been used in both theoretical and applied analyses of hydroclimatic data. Theoretical studies adopted the copula-based methodology for instance to gain a better understanding of the dependence structures of temperature and precipitation, in different parts of the world.[8][58][59] Applied studies adopted the copula-based methodology to examine e.g., agricultural droughts [60] or joint effects of temperature and precipitation extremes on vegetation growth.[61]
Climate and weather researchEdit
Copulas have been extensively used in climate- and weather-related research.[62][63]
Solar irradiance variabilityEdit
Copulas have been used to estimate the solar irradiance variability in spatial networks and temporally for single locations. [64][65]
Random vector generationEdit
Large synthetic traces of vectors and stationary time series can be generated using empirical copula while preserving the entire dependence structure of small datasets.[66] Such empirical traces are useful in various simulation-based performance studies.[67]
Ranking of electrical motorsEdit
Copulas have been used for quality ranking in the manufacturing of electronically commutated motors.[68]
Signal processingEdit
Copulas are important because they represent a dependence structure without using marginal distributions. Copulas have been widely used in the field of finance, but their use in signal processing is relatively new. Copulas have been employed in the field of wireless communication for classifying radar signals, change detection in remote sensing applications, and EEG signal processing in medicine. In this section, a short mathematical derivation to obtain copula density function followed by a table providing a list of copula density functions with the relevant signal processing applications are presented.
Mathematical derivation of copula density functionEdit
For any two random variables X and Y, the continuous joint probability distribution function can be written as

where  and
and  are the marginal cumulative distribution functions of the random variables X and Y, respectively.
then the copula distribution function  can be defined using Sklar's theorem[69][70] as:
 ,
,
where  and
and  are marginal distribution functions,
  joint and
  .
.
We start by using the relationship between joint probability density function (PDF) and joint cumulative distribution function (CDF) and its partial derivatives.

where  is the copula density function,
  and
and  are the marginal probability density functions of X and Y, respectively. It is important to understand that there are four elements in this equation, and if any three elements are know, the fourth element can be calculated. For example, it may be used,
- when joint probability density function between two random variables is known, the copula density function is known, and one of the two marginal functions are known, then, the other marginal function can be calculated, or
- when the two marginal functions and the copula density function are known, then the joint probability density function between the two random variables can be calculated, or
- when the two marginal functions and the joint probability density function between the two random variables are known, then the copula density function can be calculated.
List of copula density functions and applicationsEdit
Various bivariate copula density functions are important in the area of signal processing. and are marginal distributions functions and and are marginal density functions. Extension and generalization of copulas for statistical signal processing have been shown to construct new bivariate copulas for exponential, Weibull, and Rician distributions.[71] Zeng et al.[72] presented algorithms, simulation, optimal selection, and practical applications of these copulas in signal processing.
| Copula density: c(u, v) | Use |
|---|
| Gaussian |  | supervised classification of synthetic aperture radar (SAR) images,[73] validating biometric authentication,[74] modeling stochastic dependence in large-scale integration of wind power,[75] unsupervised classification of radar signals[76] |
| Exponential |  | queuing system with infinitely many servers[77] |
| Rayleigh | bivariate exponential, Rayleigh, and Weibull copulas have been proved to be equivalent[78][79][80] | change detection from SAR images[81] |
| Weibull | bivariate exponential, Rayleigh, and Weibull copulas have been proved to be equivalent[78][79][80] | digital communication over fading channels[82] |
| Log-normal | bivariate log-normal copula and Gaussian copula are equivalent[80][79] | shadow fading along with multipath effect in wireless channel[83][84] |
| Farlie–Gumbel–Morgenstern (FGM) | ![{\displaystyle {\begin{aligned}={}&1+\theta (1-2u)(1-2v)\\&{\text{where }}\theta \in [-1,1]\end{aligned}}}](https://wikimedia.org/api/rest_v1/media/math/render/svg/b30181c64bf603461998b09871a4969e8f86cad8) | information processing of uncertainty in knowledge-based systems[85] |
| Clayton |  | location estimation of random signal source and hypothesis testing using heterogeneous data[86][87] |
| Frank |  | change detection in remote sensing applications[88] |
| Student's t |  | supervised SAR image classification,[81] fusion of correlated sensor decisions[89] |
| Nakagami-m | | |
| Rician | | |